
Asset management dashboards solve this by pulling location, driver, maintenance, and cost data into one visual interface. Instead of hunting through five systems, managers see everything that matters in real time.
This article breaks down the four dashboard types, the KPIs worth tracking, the five pillars that should guide your framework, and what to look for in a platform.
Key Takeaways
- Centralize vehicle, driver, and maintenance data for real-time operational visibility
- Match the view to the job: operational, analytical, strategic, or tactical dashboards
- Anchor strategy in five pillars: people, systems, processes, risk, and improvement
- Pick platforms for easy install, flexible customization, and deep integrations
What Is an Asset Management Dashboard and Why It Matters
An asset management dashboard is a visual interface displaying KPIs tied to asset location, condition, utilization, and cost. It replaces static spreadsheet reports that are outdated the moment someone opens them.
Fleets once pulled data weekly or monthly, formatted a report, then circulated it—only to find conditions had already changed. Modern dashboards update continuously, so decisions reflect current reality, not last week's snapshot.
Core Components of an Effective Dashboard
A functional dashboard typically includes
- KPI cards — at-a-glance figures such as active vehicles, total trips, and cumulative miles
- Trend charts — graphs tracking utilization, braking events, and speeding over a selected date range
- Map/GIS views — real-time vehicle locations with weather and traffic overlays
- Drill-down capability — click-through from a fleet-wide number into a single vehicle or driver
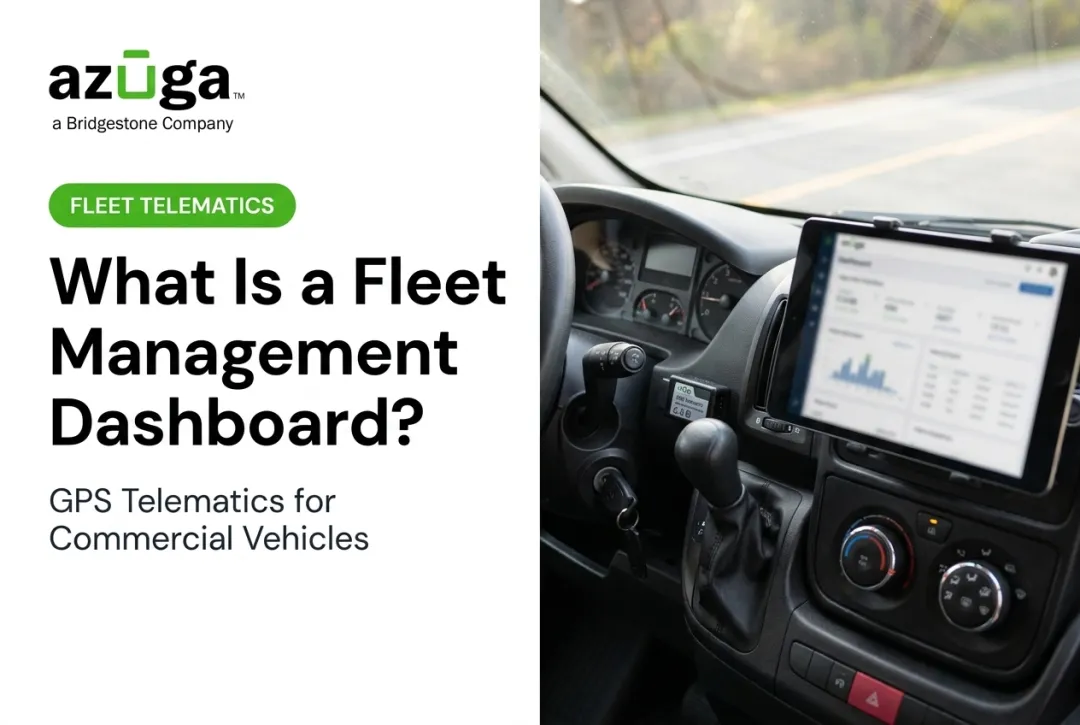
Azuga's dashboard, for example, pairs KPI tiles—active vehicles, trip totals, mileage—with an interactive map that refreshes twice per minute and layers geofence activity. A manager can see 38 active vehicles and 315 trips, then drill into which driver logged the most hard-braking events that week.

Role-based visibility matters too. A fleet manager needs vehicle utilization and driver behavior. A safety officer cares about speeding, harsh braking, and seatbelt compliance. Finance wants fuel costs and operating expenses. The best dashboards let each role customize a view without sorting through noise.
Why Fleets Specifically Need Analytics-Driven Dashboards
For construction, HVAC, plumbing, and utility companies, vehicles aren't just transportation — they're the revenue-generating asset. A technician stuck in traffic or a truck sitting idle costs money directly.
That urgency shows up in the numbers
- A 2024 Verizon Connect report of 543 fleet professionals found average fuel savings from tracking rose from 8% in 2021 to 16% by 2025
- 62% of GPS-tracking users cited improved operational efficiency
- Azuga customer data shows an average of $9,462 in annual savings per fleet through stronger cost management
Four Types of Asset Management Dashboards
Not every dashboard serves the same purpose. According to Luzmo's dashboard framework, four distinct types exist
- Operational dashboards — Real-time daily data: live GPS location, driver status, active alerts. Built for immediate action.
- Analytical dashboards — Historical trend analysis. Useful for spotting patterns in maintenance costs or accident frequency over months, not hours.
- Strategic dashboards — High-level KPIs tied to company goals. Senior leadership uses these for long-term planning around fleet cost, safety, and replacement cycles.
- Tactical dashboards — Mid-level views for department managers tracking regional or team performance against targets, often used for root-cause investigation.

A single fleet platform can support all four. Daily operations watches the live map, safety reviews monthly braking trends, and finance checks quarterly cost-per-mile against budget.
Key KPIs and Metrics to Track
Tracking everything is worse than tracking nothing. It buries the metrics that matter. Focus on four categories.
Vehicle location and utilization:
- Real-time GPS position and breadcrumb trails
- Idle time, including duration and location of each incident
- Total trips, drive time, and cumulative miles
Driver safety metrics:
- Speeding alerts and hard-braking events
- Distraction events (phone use, food/drink, seatbelt non-compliance)
- Driver scores and accident frequency
Maintenance and asset health:
- Diagnostic trouble codes and check-engine light alerts
- Service due dates tracked by mileage, engine hours, or date
- Overdue maintenance flags
Financial metrics:
- Fuel cost and consumption
- Operating cost per vehicle or vehicle group
- Total cost of ownership across a custom date range

Driver behavior visibility ties directly to safety outcomes. A US DOT field operational test covering 317 commercial drivers across four fleets found that onboard monitoring reduced critical-event rates. Separately, Azuga's own performance data shows customers averaging a 38% decrease in accidents and a 57% reduction in speeding citations.
Azuga's platform captures much of this through 30-second interval GPS tracking (twice as frequent as one-minute plans), combined with AI dashcam analytics that flag distracted driving and generate coaching video clips automatically.
The Five Pillars of Asset Management Explained
A dashboard is only as useful as the framework behind it. Build your fleet asset management strategy around five pillars
- People — Train teams to interpret dashboard data and act on it, not just glance at numbers
- Information systems — Feed the dashboard with telematics, fuel cards, and integrations; Azuga connects with 75+ partners, including Comdata and SambaSafety
- Processes — Standardize workflows triggered by alerts, such as automatic maintenance when a diagnostic code appears
- Risk management — Reduce liability with dashboard data such as collision reconstruction footage. Azuga notes that 70% of accidents aren't the fault of the fleet's own drivers, and video evidence protects them from unfair claims
- Continuous improvement — Refine coaching with historical analytics over time. Azuga's coaching engine draws on data from more than 3,500 fleets and 4 billion miles
These pillars work together. Strong information systems power better processes, and those processes cut risk. Risk data then fuels continuous improvement—skip one pillar, and the whole system weakens.

Benefits and Best Practices for Implementation
Real business gains show up quickly:
- Real-time visibility beats a report that's a week stale
- Maintenance budgets go to vehicles that actually need work, not a fixed schedule
- Visible driver scores build a safety culture people can see and act on
Marlboro Towing's general manager credited Azuga's "intuitive reports and dashboards" with improving truck utilization visibility and driver behavior tracking. Kitsap Garage Door Company used similar dashboard data to validate employee time cards and cut fuel-wasting idle time, reporting strong ROI.
Those results stick when rollout stays focused. Two practices matter most
- Define your priority metrics first. Don't buy a platform and try to track everything. Decide whether safety, cost, or utilization matters most, then pick a dashboard built around that.
- Prioritize easy deployment. Azuga's battery-powered, hardwired, and Bluetooth beacon trackers mount to the asset without a complex shop visit or long downtime. With 24/7 phone, email, and web support, that removes the friction that stalls most rollouts, from four trucks to four hundred.
Frequently Asked Questions
What are the five pillars of asset management?
People, information systems, processes, risk management, and continuous improvement. Together they form a practical framework for building and sustaining an effective fleet dashboard strategy.
What are the four types of dashboards?
Operational (real-time daily data), analytical (historical trends), strategic (high-level company goals), and tactical (department-level performance tracking). Most fleets use a mix of all four.
How often should asset management dashboard data be updated?
It depends on the use case, but modern platforms update near-continuously. Azuga's CompleteFleet plan refreshes GPS location every 30 seconds for near real-time accuracy.
Can small businesses benefit from asset management dashboards?
Yes. Packages matched to fleet needs, like Azuga's plans with packages matched to fleet needs, make dashboards practical for fleets with as few as one to four vehicles.
What is the difference between a fleet dashboard and a general asset management dashboard?
Fleet dashboards focus specifically on vehicle and driver metrics: location, safety events, and maintenance. General asset management dashboards can cover broader enterprise assets, including equipment and facilities.
How do dashboards help reduce fleet costs?
They surface fuel waste, overdue maintenance, and risky driving before those issues become expensive. Azuga customers report average accident reductions of 38% and operational cost cuts up to 30% through improved visibility.