
Fleets generate mountains of data every day, GPS pings, fuel transactions, harsh-braking events, diagnostic alerts. Yet most of it never becomes a decision. It sits in a system, unread. That gap between data collected and data used is exactly where preventable accidents happen, fuel gets wasted, and vehicles break down without warning.
This guide covers what fleet management analytics actually means, the types of data worth tracking, the KPIs that matter most, and how to convert raw numbers into measurable savings and safety gains.
Key Takeaways
- Fleet data pays off only when it drives decisions on routes, maintenance, and driver coaching
- Track a focused set of metrics, such as cost per mile, utilization, and safety score, rather than everything measurable
- Predictive analytics shifts fleets from reactive repairs to planned maintenance, cutting unplanned downtime
- The right telematics platform automates data collection, freeing managers to act instead of compiling spreadsheets
What Is Fleet Management Analytics?
Fleet data is the raw information your vehicles, drivers, and equipment generate: GPS coordinates, fuel levels, harsh-braking alerts, odometer readings, diagnostic trouble codes. On its own, that's just numbers sitting in a database.
Fleet analytics is what happens next: the process of interpreting that raw data to find patterns and guide decisions. It typically draws from telematics devices, GPS trackers, dashcams, electronic logging devices, and maintenance software, all feeding into one centralized dashboard rather than five disconnected systems.
Here's a simple way to think about it. Fleet data tells you what happened: a truck idled for 45 minutes, a driver braked hard three times on one trip.
Fleet analytics tells you why it happened and what to do next — maybe that driver needs coaching, or that route has a bottleneck causing excessive idling near a loading dock.
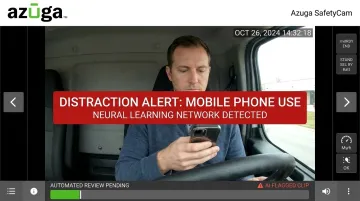
Modern platforms increasingly apply AI to catch these patterns automatically instead of requiring a manager to build pivot tables every Friday afternoon. Azuga's SafetyCam AI, for instance, runs driver-facing video through a neural learning network that flags possible distraction events without anyone manually reviewing hours of footage.
Fleet Data vs. Fleet Analysis: Key Difference
The distinction comes down to this
| Term | What It Means |
|---|---|
| Fleet data | Raw collection: GPS points, fuel transactions, DTC codes, video clips |
| Fleet analysis | Decision-ready insight: this driver needs coaching, this route wastes 12 minutes per trip, this vehicle needs service before it fails |
One is a warehouse of facts. The other tells you what to build with them.
Types of Fleet Data You Should Be Tracking
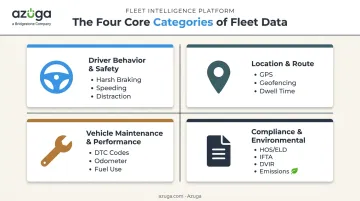
Fleet data spans several categories, and understanding each one is the foundation for effective analysis. Miss one category, and you'll have blind spots. A fleet that watches fuel closely but ignores driver behavior will still get hit with avoidable accidents.
Driver Behavior & Safety Data
This category includes harsh braking, rapid acceleration, speeding events, distracted driving alerts, and seatbelt compliance. AI dashcams, like Azuga's SafetyCam, capture these moments as they happen, turning raw footage into coaching alerts that flag drivers who need attention before a habit becomes a collision.
The American Transportation Research Institute analyzed more than 580,000 truck-driver records and found that a prior crash increases the likelihood of a future crash by 113%, while a reckless-driving conviction raises that likelihood by 114%. These are risk-prediction figures, not preventability percentages, but they make a strong case for coaching drivers with risky patterns before another incident happens.
Location & Route Data
GPS coordinates, geofencing alerts, route adherence, dwell time, and arrival and departure timestamps all fall here. Together, they answer questions dispatchers ask constantly: Is this driver on the fastest route? Why did this stop take 40 minutes instead of 15? A geofence around a client site, for example, can automatically log arrival and departure, cutting manual timekeeping disputes.
Vehicle Maintenance & Performance Data
Diagnostic trouble codes, odometer readings, inspection results, and fuel consumption rates form the backbone of predictive maintenance. Rather than waiting for a breakdown, live DTC alerts flag issues as they emerge.
Chris Barbayanni, Fleet Director at Smith & Solomon, uses this combination in a practical way. He set a geofence around his repair shop, so a DTC alert on a truck heading toward the shop triggers an immediate notification.
From there, he can alert the mechanic on duty or redirect the driver in for proactive service before a small issue becomes a major one.
Compliance & Environmental Data
This bucket covers HOS and ELD logs, IFTA fuel-tax reporting, DVIR inspection records, and emissions or idling data. It exists to avoid fines and reduce environmental impact, and the retention rules matter more than most managers realize:
- ELD records of duty status must be retained for six months
- IFTA distance and fuel records must be preserved for four years from the filing date
- DVIR requirements differ for property-carrying versus passenger-carrying vehicles
Building these retention windows into your analytics dashboard means you're never scrambling during an audit.
Top Fleet Management KPIs and Metrics to Track
Tracking too many metrics creates noise. Fleet managers get the most value from a focused set of KPIs tied directly to business goals, not a dashboard cluttered with everything the telematics device can measure.
Efficiency and Utilization Metrics
Cost per mile. Calculated as Total Fuel/Operating Cost ÷ Total Miles Driven, this metric reveals whether your fleet is actually efficient or just busy. It's the single number that ties fuel, maintenance, and labor together into one comparable figure across vehicles or routes.
Vehicle utilization rate. Divide Active Time by Total Available Time to get this metric, which shows whether vehicles are earning their keep or sitting idle in the yard. There's no single universal "healthy" benchmark across industries. Your target should reflect your duty cycle, seasonality, and reserve capacity needs, not a generic percentage pulled from an unrelated fleet type.
Safety, Maintenance, and Fuel Metrics
Maintenance and downtime metrics. Three numbers matter most here
- Preventive maintenance compliance rate
- Average downtime per vehicle
- Repair turnaround time
Safety score and accident rate. Driver scorecards aggregate harsh-braking, speeding, and distraction events into a single trackable score, making it easy to spot which drivers need coaching before their behavior shows up as an accident report.
Fuel efficiency (MPG) and idling time. These are often the fastest metrics to show ROI after adopting analytics. The EPA estimates a typical long-haul combination truck could save more than 900 gallons of fuel annually by eliminating unnecessary idling, a number that translates directly into cost per mile.
Key Benefits of Fleet Data Analytics
Lower operational costs. When routing and maintenance decisions are backed by data instead of guesswork, the savings compound quickly. Azuga reports that fleets using its platform reduce operational costs by up to 30%, saving an average of $9,462 annually through better cost management. These figures come from Azuga's own customer data, not an independent study.
Fewer accidents and citations. Monitoring driver behavior through AI dashcams and collision reconstruction tools changes how drivers act on the road in real time. Azuga customers report an average 38% decrease in accidents and a 57% reduction in speeding citations.
This pattern holds across the industry. Geotab reported a 40% reduction in collision rates among fleets using its safety features, confirming these results aren't a one-vendor anomaly.
Reduced liability exposure. Video evidence changes the outcome of disputed claims. Azuga's SafetyCam AI Collision Reconstruction helps exonerate drivers and supports insurance claims when fault is contested. This same evidence also protects fleets from costly litigation after an accident.
How to Collect, Analyze and Act on Fleet Data
Turning raw data into results follows a repeatable process
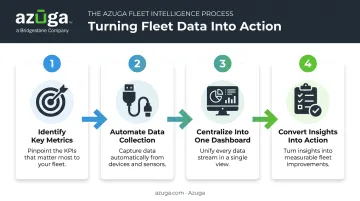
Identify 3-5 key metrics tied to a specific goal. Don't try to track everything at once. If cost reduction is the priority, start with cost per mile and fuel efficiency. If safety is the focus, start with harsh-event frequency and accident rate.
Automate data collection with telematics hardware. OBD-II devices, dashcams, and sensors remove the manual logging that causes gaps and errors. A self-install OBD-II device, like the one Azuga ships, plugs in without a technician visit, so fleets start collecting clean data the same day.
Centralize everything into one dashboard. Patterns hide when data lives in five different spreadsheets. A single reporting view makes outliers, like a vehicle with rising fuel costs or a driver with a climbing harsh-braking count, visible at a glance instead of buried in a monthly export.
Convert insights into action, then monitor results. Coach a flagged driver, schedule service for a vehicle with recurring DTC alerts before it fails on the road, and adjust routes with excessive dwell time. Then you track whether the change actually moved the metric, and refine from there.
Choosing the Right Fleet Analytics Platform
Not every telematics platform delivers usable analytics—some just dump data on you. When evaluating options, weigh these criteria
- Ease of installation — plug-and-play beats a service appointment every time
- Integration depth — connects with your existing fuel cards, ELDs, and dispatch software
- GPS update frequency — 30-second intervals catch far more than 5-minute pings
- AI-based safety features — dashcams that flag distraction automatically save review time
- Total cost of ownership — scalable packaging that's easy to model against fleet size
For small and mid-sized fleets weighing total cost of ownership, a self-install OBD-II device matters more than it sounds. Azuga's device installs in minutes without a technician. Its BasicFleet plan matches packages to fleet needs, giving smaller operations a low-friction entry point before adding dashcams or ELD compliance as needs grow.
Cost and installation ease matter, but data frequency determines how actionable those insights become in daily operations. A platform pinging every 30 seconds catches route deviations and idling patterns that a slower system would miss entirely. Pair that with round-the-clock support, since a maintenance alert at 2 a.m. shouldn't wait until business hours to get resolved.
Frequently Asked Questions
What is fleet analysis?
Fleet analysis is the process of examining fuel use, mileage, driver behavior, and maintenance records to understand fleet performance and identify improvement opportunities. It turns raw telematics data into specific, actionable recommendations.
What is the best fleet tracking system?
The best system depends on fleet size and goals, but it should combine real-time GPS tracking, driver safety analytics, and easy installation. Azuga's plug-and-play GPS platform is built specifically around that combination for small and mid-sized fleets.
What is the difference between fleet data and fleet analytics?
Fleet data is raw information such as GPS points, fuel logs, and DTC codes. Fleet analytics interprets that data to find patterns and recommend specific actions, like coaching a driver or rescheduling maintenance.
What are the most important fleet KPIs to track?
Cost per mile, vehicle utilization rate, safety score, and preventive maintenance compliance rate top the list. These four metrics tie directly to cost, safety, and uptime, the outcomes most fleets actually care about.
How much does fleet management software typically cost?
Most platforms use per-vehicle monthly pricing that scales with fleet size and selected features. Azuga matches packaging to fleet size and the features you select, with pricing rising as dashcams, ELD compliance, or additional add-ons are included.
How often should fleet data be reviewed?
Review core KPIs weekly or monthly to spot trends, while urgent safety or maintenance alerts should trigger real-time notifications. Waiting for a monthly report to catch a critical DTC code defeats the purpose of live tracking.