
Yet many fleets still run on gut feel. A technician thinks a truck "seems fine." A spreadsheet gets updated when someone remembers. When leadership asks for proof that maintenance spend is paying off, there's nothing concrete to show.
This guide breaks down the fleet maintenance KPIs worth tracking in 2026, how to calculate each one, and how GPS fleet tracking technology turns manual guesswork into automatic, real-time data.
Key Takeaways
- Track 3-5 core maintenance KPIs to avoid data overload and stay focused
- Metrics report what happened; KPIs define the target, like 95% PM compliance
- GPS tracking automatically logs vehicle data, cutting manual errors
- Pair leading and lagging KPIs to manage both future risk and past results
Maintenance Metrics vs. KPIs: What's the Difference?
A metric is a raw data point. "We completed 8 preventive services this month" is a metric. It tells you what happened, nothing more.
A KPI is that same data measured against a target. "We're aiming for 95% PM compliance, and we hit 87%" turns a number into a performance signal. Not every metric qualifies as a KPI: only the ones tied directly to your organization's critical goals count.
Here's the distinction in practice
| Question | Answered By |
|---|---|
| What happened? | Metric |
| Are we hitting our goal? | KPI |
| What predicts future problems? | Leading indicator |
| What reflects past performance? | Lagging indicator |
Leading indicators, like PM compliance, predict future reliability. Miss your PM schedule this month, and breakdowns tend to follow next quarter.
Lagging indicators, like maintenance cost per mile, show the financial result of decisions you already made. A data-driven fleet strategy needs both: leading KPIs tell you where you're headed, while lagging KPIs confirm whether you got there.
Essential Fleet Maintenance KPIs to Track in 2026
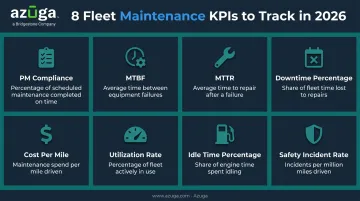
These eight KPIs cover vehicle reliability, technician efficiency, and maintenance spend. You don't need all eight running at once. Pick 3-5 based on your current pain points, and expand from there.
Preventive Maintenance Compliance (PMC)
PMC measures the percentage of scheduled preventive tasks (oil changes, inspections, brake checks) completed on time.
Formula: (Completed PMs ÷ Scheduled PMs) x 100
Many fleet software platforms apply a "10% rule," flagging a task as late once it's completed more than 10% past its due date or mileage interval. So a service due every 5,000 miles would be marked late after 5,500 miles.
There's no single universal PMC benchmark across all fleet types, but most fleets treat anything meaningfully below 90% as a signal that scheduling or shop capacity needs attention.
Mean Time Between Failures (MTBF)
MTBF measures the average operating time (in miles or hours) a vehicle runs before an unplanned breakdown.
Formula: Total Operating Time ÷ Number of Failures
Example: a delivery van fleet logs 60,000 miles across 5 vans in a quarter, with 3 breakdowns reported. MTBF = 20,000 miles between failures. Track this by vehicle class and duty cycle, since a stop-and-go delivery van wears differently than a highway-running box truck.
Mean Time to Repair (MTTR)
MTTR tracks the average time it takes to get a vehicle back on the road after a breakdown.
Formula: Total Repair Time ÷ Number of Repairs
Parts shortages, technician availability, and towing delays all inflate MTTR. Lower MTTR means fewer missed service jobs, less idle labor, and less reliance on backup vehicles.
For example, a regional delivery fleet averaging a 3-hour MTTR loses roughly half a shift of productivity per breakdown. Tracking MTTR by repair category, such as engine, brakes, or electrical, often reveals which failure types are costing you the most time.
Fleet Downtime Percentage
This shows what percentage of scheduled operating time a vehicle sits out of service for maintenance or repair.
Formula: (Downtime Hours ÷ Total Scheduled Hours) x 100
Downtime is expensive. One widely cited estimate from Fleet Maintenance's reporting on Element Fleet Management data put the cost of a single day of vehicle downtime between $448 and $760, once you factor in driver pay, lost productivity, and missed revenue.
That figure is a historical estimate, not a current universal average, but it illustrates why every hour a truck sits idle costs more than the repair bill alone.
Maintenance Cost Per Mile (or Per Vehicle)
This is total maintenance spend divided by miles driven, or by number of vehicles if mileage varies widely across your fleet.
Formula: Total Maintenance Cost ÷ Total Miles Driven
For context, ATRI's 2023 operational cost benchmark put average repair and maintenance expense for for-hire trucking at $0.202 per mile, up 3.1% year over year.
That number applies specifically to trucking, not every commercial fleet, but tracking your own cost-per-mile trend over time is what actually matters: a steadily rising line is often the clearest signal it's cheaper to replace a vehicle than keep repairing it.
Vehicle Utilization Rate
Utilization measures how much of a vehicle's available capacity actually gets used in the field (miles driven, days active, or hours in service) compared to what's possible.
Underutilized vehicles quietly drain budget. A van sitting idle three days a week still costs you insurance, depreciation, and a parking spot. Reviewing utilization data regularly helps identify candidates for fleet right-sizing before the next lease renewal or purchase decision.
Idle Time Percentage
Idle time is the percentage of engine-on time a vehicle isn't moving.
Excessive idling accelerates engine wear and burns fuel for zero productivity. A heavy-duty truck idling consumes roughly 0.8 gallons per hour, and the EPA estimates that eliminating unnecessary idling can save a typical long-haul truck more than 900 gallons a year.
This is a metric manual logs simply can't capture accurately. You need telematics data pulling idle time automatically, vehicle by vehicle. Platforms like Azuga's GPS tracking flag excessive idling in real time, giving managers a chance to act before fuel costs pile up.
Safety Incident Rate
This tracks accidents, speeding events, or harsh-braking incidents per vehicle or per mile driven.
A strong maintenance and driver-safety program directly lowers this rate. In a Virginia Tech Transportation Institute pilot of 21 IVMS-equipped trucks, speeding events dropped 60% and aggressive-driving incidents fell 50% after installing in-vehicle monitoring systems. Results like these depend heavily on pairing the technology with active coaching, not just installing a camera and hoping.
How to Choose the Right KPIs for Your Fleet
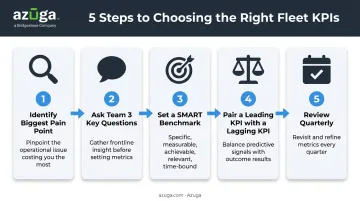
Don't try to track everything at once. Start with your biggest pain point
- Are unplanned breakdowns disrupting schedules?
- Is fuel and repair cost climbing faster than revenue?
- Are technicians missing service windows?
Ask your team three questions:
- What outcome matters most this quarter?
- Which metrics can we actually measure with our current tools?
- Who owns accountability for each KPI?
Once you've narrowed your focus, set SMART benchmarks (Specific, Measurable, Achievable, Relevant, Timely). Instead of "reduce downtime," aim for "reduce fleet downtime from 8% to 5% by Q3."
With your benchmark defined, pair one leading KPI with one lagging KPI to capture both effort and results. PM compliance (leading) tells you whether you're setting the fleet up for success. Maintenance cost per mile (lagging) tells you whether it worked. Tracking only one side gives you half the picture.
KPIs shouldn't be static. As your fleet grows or priorities shift (a new contract, added vehicles, a shift toward electric trucks), plan quarterly reviews rather than setting targets once a year and forgetting them.
Best Practices for Using Fleet Maintenance KPIs Effectively
Getting the formulas right doesn't matter if the underlying data is unreliable, and a few practices separate fleets that actually improve from those that just collect numbers
- Use a single source of truth. Combining manual logs, spreadsheets, and driver-reported notes almost guarantees conflicting numbers, so GPS tracking or fleet maintenance software should be the record everyone trusts.
- Communicate results regularly. Technicians and drivers need to see how their daily work moves the numbers, so a monthly huddle showing PM compliance or MTTR trends builds buy-in faster than a memo.
- Dig into root causes, not just the number. If MTTR is climbing, ask why: is it parts availability, or a technician training gap? A short root-cause conversation each time a KPI misses target prevents the same issue from repeating next quarter.
How Azuga Helps Fleets Track Maintenance KPIs in Real Time
Manual tracking is where most KPI programs quietly fall apart. Azuga's plug-and-play OBD-II device captures vehicle data automatically at 30-second intervals, logging mileage, engine hours, idle time, and diagnostic trouble codes to remove the guesswork behind KPIs like utilization and idle time percentage.
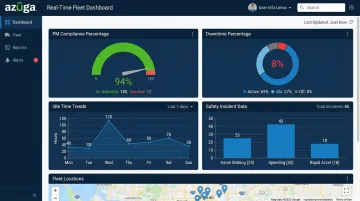
That data feeds into real-time dashboards, giving fleet managers instant visibility into
- Vehicle health trends that flag maintenance issues before they turn into breakdowns
- Idle time and utilization reports that help right-size the fleet
- Automated maintenance scheduling and reminders tied to mileage or engine run time
For the Safety Incident Rate KPI, Azuga SafetyCam AI with Collision Reconstruction captures dual-facing HD video and event data to help identify what actually caused an accident, supporting both coaching and liability protection.
Fleets using Azuga have reported an average 38% reduction in accidents and a 57% drop in speeding citations. Actual results vary by fleet baseline and program design, though the pattern matches broader industry telematics data.
Instead of chasing numbers across spreadsheets, fleet managers get one dashboard where PM compliance, downtime, idle time, and safety data live side by side.
Frequently Asked Questions
What are the KPIs for maintenance and operations?
Core maintenance and operations KPIs include PM compliance, MTBF, MTTR, downtime percentage, and maintenance cost per mile. Each measures a different piece of the puzzle: reliability, repair speed, availability, or spend.
What are the 5 basic maintenance skills?
Every maintenance technician needs diagnostic troubleshooting, preventive maintenance execution, basic mechanical and electrical repair skills, accurate record-keeping, and consistent adherence to safety procedures.
How many KPIs should a fleet track at once?
Stick to 3-5 KPIs at a time. Tracking more creates data overload and dilutes team focus on the metrics that matter most right now.
What's the difference between a maintenance metric and a KPI?
A metric is a raw data point describing what happened. A KPI is the target benchmark used to judge whether that performance is actually on track.
How does GPS fleet tracking improve maintenance KPI accuracy?
GPS and telematics devices, like Azuga's OBD-II trackers that report every 30 seconds, capture vehicle data automatically and eliminate manual entry errors. This gives fleet managers up-to-the-minute visibility into metrics like idle time and utilization that manual logs can't reliably track.
What is a good benchmark for fleet vehicle downtime?
Many fleets aim for downtime below 5-8% of scheduled operating time, though the ideal target varies by vehicle type, age, and duty cycle. Benchmarking against your own historical data is often more useful than a universal number.