
Introduction
A commercial vehicle crash with an injury now costs a fleet an average of $383,569, according to FMCSA's 2025 crash cost methodology. Even a crash without injuries runs $49,261 on average. Neither figure counts the downtime, replacement hiring, or reputational damage that follows.
Most fleets still find out about risk after it shows up in a police report. They review accident logs, tally claims, and hope next quarter looks better. That's a reactive approach built on lagging indicators — data that only confirms what already went wrong.
The better approach tracks the behaviors that predict a crash before it happens. This guide breaks down the driver behavior metrics that matter most and how they roll up into scorecards and safety scores. It also covers the technology that captures them and the coaching habits that actually change outcomes.
Key Takeaways
- Speeding, harsh braking, cornering, and phone distraction drive most fleet risk models
- Scorecards convert telematics data into weighted, easy-to-read scores for coaching
- OBD-II devices and AI dashcams bring real-time behavior monitoring to fleets of any size
- Consistent coaching, SMART goals, and gamification turn metrics into safer driving
What Are Driver Behavior Metrics?
Driver behavior metrics are quantifiable data points (captured through GPS, OBD-II sensors, or a smartphone's accelerometer) that describe how a driver actually operates a vehicle in real time. Speed, braking force, turning angle, phone handling: these get measured continuously, not reconstructed after the fact.
They're distinct from two other metric types fleets track
- Compliance metrics: Hours of Service logs, inspections, license and MVR checks. These confirm a driver is following regulations, not how safely they're operating the vehicle moment to moment.
- Outcome metrics: accidents, insurance claims, citations. These measure what already happened.
Behavior metrics fall into a different category entirely: leading indicators. A driver who brakes hard four times on a single route hasn't crashed, but that pattern correlates strongly with future risk.
Outcome metrics confirm damage after the fact. Behavior metrics create room to intervene before the pattern becomes a collision. That's the logic behind every scorecard program.
The Core Driver Behavior Metrics Every Fleet Should Track
Telematics platforms can capture dozens of data points, from throttle position to GPS heading changes. Research consistently narrows that list down to a handful of behaviors with the strongest ties to crash risk. Tracking everything equally just creates noise. These are the ones worth weighting heavily.
Speeding
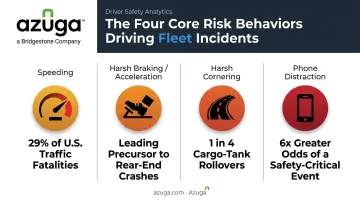
Speeding carries the heaviest weight in most fleet risk models, and the reasoning is straightforward: higher speed means longer stopping distance and higher-energy impacts when a collision happens. The numbers back it up. In 2023, speeding-related crashes killed 11,775 people, or 29% of all U.S. traffic fatalities, according to NHTSA.
For fleets, that means every mile driven above the posted limit, or too fast for conditions, adds measurable risk. One instance of five-over on a highway on-ramp isn't necessarily reckless. A pattern of repeated speeding events, though, is one of the clearest predictors of future collision involvement a fleet can measure.
Harsh Braking and Rapid Acceleration
Frequent harsh braking or rapid acceleration events usually point to one of a few habits: tailgating, distraction, or an aggressive driving style with no margin for error. A driver who's constantly slamming the brakes is often following too closely to react smoothly to traffic ahead.
Modern accelerometer-based detection has gotten better at separating real events from road noise. Early telematics systems flagged every pothole and speed bump as a "harsh" event, which made drivers distrust the data entirely. Today's systems calibrate thresholds against vehicle speed and direction, filtering out surface jolts so the flagged events more reliably reflect an actual driving decision.
Harsh Cornering
Hard cornering is a known precursor to rollover and loss-of-control incidents, particularly in vehicles with a high center of gravity, such as vans, box trucks, and cargo tankers. FMCSA's rollover research attributes roughly one in four cargo-tank rollovers to excessive cornering speed, and the agency notes that driver error contributes to more than three-quarters of those incidents.
Cornering events shouldn't be read in isolation. A hard-corner flag paired with high entry speed on a known curve tells a very different story than the same lateral force on a straight, flat road. Vehicle type, load, and road geometry all factor in.
Mobile Phone Distraction
Distraction affected 8% of fatal crashes in 2023, killing 3,275 people, per NHTSA data. The risk climbs sharply for commercial drivers: FMCSA reports that a CMV driver dialing a handheld phone has six times greater odds of a safety-critical event than an attentive driver.
Detecting this behavior has gotten more sophisticated. Motion sensors flag phone movement patterns consistent with handheld use, while AI-enabled dashcams add a visual layer, watching for the head-down posture or hand-to-ear position that signals distraction even when a driver is technically hands-free.
Idling and Seatbelt Usage
These won't top a crash-risk model the way speeding does, but they add useful operational and safety context
- Idling wastes fuel and adds engine wear without moving the vehicle: more of a cost problem than a crash-risk one
- Seatbelt usage doesn't prevent a crash, but it dramatically changes the outcome when one happens
Here's a quick reference for how the core metrics stack up
| Metric | What It Indicates | Why It Matters |
|---|---|---|
| Speeding | Excess speed vs. limit or conditions | Longer stopping distance, higher crash severity |
| Harsh braking/acceleration | Tailgating, distraction, aggressive style | Precursor to rear-end and loss-of-control crashes |
| Harsh cornering | Excess speed into turns, high-center-of-gravity risk | Precursor to rollover incidents |
| Phone distraction | Handheld or hands-free device use while driving | 6x greater odds of a safety-critical event (CMV) |
| Idling | Excess engine run time without movement | Fuel waste, engine wear, emissions cost |
| Seatbelt usage | Restraint compliance | Reduces injury severity if a crash occurs |
Turning Metrics into Driver Scorecards and Safety Scores
A driver scorecard takes those individual behavior metrics and turns them into something a manager can act on: a report showing each metric's score alongside a summary comparing that driver to fleet averages or goals. Instead of scrolling raw event logs, a manager sees one page — this driver speeds more than average, brakes hard less, and needs a conversation about phone use.
How the Weighting Works
Not every behavior gets equal weight in a composite score. Fleets and telematics providers typically lean on historical claims and crash data to decide which events matter most
- Speeding and harsh braking usually carry heavier weight, since they correlate most strongly with claims history
- Cornering and idling often get lighter weight as supplementary or contextual signals
- Weightings shift over time as a fleet's own claims data accumulates
Tiers and Triggers
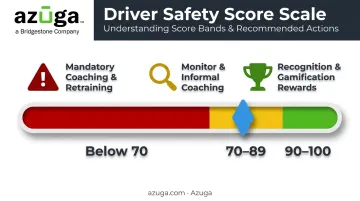
Most scorecard systems use a 0-100 scale or color-coded bands, with management action tied to each tier
- Green (roughly 90-100): Recognition, gamification rewards, "most improved" callouts
- Yellow (roughly 70-89): Monitor closely, informal coaching conversation
- Red (below 70): Mandatory coaching session, retraining, possible duty restrictions
These tiers only work if the underlying score is accurate, and that accuracy depends heavily on data frequency. Azuga's platform, for example, captures GPS data every 30 seconds rather than every few minutes. That higher frequency means the score reflects what actually happened on the road, not a rough approximation between long polling gaps.
The score matters less than the coaching conversation that follows it. In Azuga's Numotion case study, driver scores climbed steadily through repeated two-way reviews between managers and drivers, and speeding, sudden acceleration, and hard braking events dropped to practically zero per 100 miles.
Diamond Engineering used similar telematics data to negotiate a 10%+ discount on its commercial auto insurance premium. A NIOSH field study of more than 600 commercial drivers found the same pattern at scale. Pairing telematics alerts with weekly human coaching cut risky-driving-event odds nearly in half, while instant in-cab alerts alone produced no significant improvement.
How Telematics Technology Captures These Metrics
Hardware Options
Fleets generally choose between three approaches, and installation ease matters most for smaller operations without a dedicated maintenance shop
- OBD-II plug-and-play devices — connect directly to a vehicle's diagnostic port; Azuga's tracker installs in minutes, with no technician required
- Dedicated GPS/asset trackers — wired units for equipment without an OBD-II port, like trailers or generators; more work to install, but broader coverage across mixed fleets
- Smartphone apps — the lowest-friction entry point, using a phone's built-in sensors for fleets not yet ready to invest in dedicated hardware
For a five-vehicle contractor fleet, the OBD-II route usually wins on speed and cost of adoption alone.
AI Dashcams Add the Missing Context
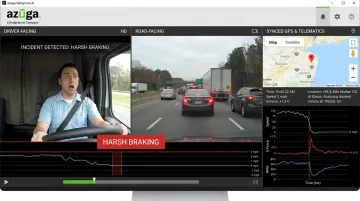
Raw event data tells you what happened. Video tells you why. Azuga's SafetyCam AI Collision Reconstruction pairs dual-facing HD cameras with an AI neural network that reviews driver-facing footage for distraction cues, then syncs that video with GPS and telematics data at the moment of an incident.
That combination proves critical after a crash. In one documented case, stored dashcam footage helped a driver avoid a $1 million claim and more than $50,000 in forensic reconstruction costs by proving fault lay elsewhere.
This isn't an isolated result. Azuga reports that 70% of accidents involving its fleet customers turn out not to be the driver's fault once objective video and data enter the picture.
From Data to Action: Best Practices for Improving Driver Behavior
Metrics without action are just numbers on a screen. Here's what separates fleets that improve safety scores from fleets that just collect them.
Build a Coaching Cadence
Schedule one-on-one scorecard reviews on a fixed calendar rather than waiting for an incident to force the conversation. The NIOSH study cited above found this exact pattern: coaching plus instant feedback drove significant improvement, while alerts alone didn't move the needle.
In that study, 88% of drivers with qualifying events received a logged coaching session. Treat that completion rate as its own KPI.
Set SMART Goals
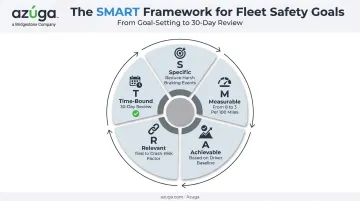
Vague direction like "drive safer" doesn't change behavior. Specific, measurable targets do
- Specific: Reduce harsh braking events
- Measurable: From 8 to 3 per 100 miles
- Achievable: Based on the driver's current baseline
- Relevant: Tied to a known crash-risk factor
- Time-bound: Within 30 days, reviewed at the next check-in
Gamify and Incentivize
Leaderboards and recognition programs keep drivers engaged with their scores long after the novelty wears off. GalaxyOne Marketing tied driving performance to compensation and saw its insurance carrier take notice of the resulting culture shift. Reward top scorers publicly; coach low scorers privately.
Review Trends at the Fleet Level
Individual events matter, but monthly or quarterly trend reviews connect the dots. Look at exposure-normalized numbers, meaning events per 100 miles rather than raw counts, so a high-mileage route doesn't unfairly look riskier than it is.
Frequently Asked Questions
How do you measure driver performance?
Performance combines telematics behavior data (speeding, braking, cornering), MVR checks, and outcome metrics like accidents or claims. Most fleets consolidate all three into a single scorecard or composite score.
What is a normal driving score?
There's no official industry-wide benchmark. Most 0-100 scales treat 90-100 as excellent, 70-89 as acceptable, and below 70 as needing improvement. Exact bands vary by telematics provider and fleet policy.
What does KPI stand for in driving?
KPI stands for Key Performance Indicator. In fleet safety, that means measures like violation counts, harsh event frequency, or coaching completion rates used to gauge how well a safety program is working.
What are SMART goals for drivers?
SMART goals are Specific, Measurable, Achievable, Relevant, and Time-bound targets. An example: reducing harsh braking events from 8 to 3 per 100 miles within 30 days.
How often should fleets review driver behavior metrics?
Set up real-time alerts for critical safety events, then supplement with weekly or monthly scorecard reviews for trend analysis and scheduled coaching conversations.
What's the difference between a driver scorecard and a safety score?
A scorecard is the detailed, multi-metric report per driver. A safety score is the single composite number calculated from those weighted metrics.