
It ripples through fuel budgets, maintenance schedules, and customer satisfaction. Highway congestion alone cost U.S. trucking $108.8 billion in 2022, a 15% jump from the year before, according to the American Transportation Research Institute.
Many fleet managers still track vehicles with spreadsheets, phone calls, and gut instinct. That approach leaves fuel waste, missed maintenance windows, and safety risk on the table. This guide breaks down what fleet optimization actually means and how it works, stage by stage.
Key Takeaways
- Fleet optimization runs as a continuous, data-driven cycle, not a one-time software purchase
- It runs on four stages: data collection, analysis, execution, and monitoring
- GPS and telematics hardware make real-time decisions possible at scale
- Azuga fleets see 38% fewer accidents and $9,462 in average annual savings
- Priorities shift by industry: delivery fleets chase routes, service fleets chase uptime
What Is Fleet Optimization?
Fleet optimization is the strategic use of data, technology, and process discipline to get maximum value from every vehicle and driver while minimizing operational cost. Rather than a single tool, it functions as an integrated discipline spanning routing, maintenance timing, driver behavior, and cost control.
Cost pressure on fleets keeps building year over year. Commercial vehicle repair and maintenance costs rose 3.1% to $0.202 per mile in 2023, according to ATRI's operational cost study. Every inefficient mile now costs more than it did a year earlier.
What Fleet Optimization Is Not
A common misconception: fleet optimization equals GPS tracking. It doesn't. GPS tracking is one input among several. True optimization also includes
- Predictive maintenance scheduling based on real diagnostic data
- Driver behavior scoring and coaching programs
- Route and dispatch efficiency
- Compliance documentation (HOS logs, DVIRs)
- Cost tracking across fuel, repairs, and insurance
Why it exists: rising vehicle and parts costs, tighter budgets, and growing safety liability pushed fleet management from reactive repairs to proactive prevention.
It Looks Different by Fleet Type
A last-mile delivery fleet cares most about shaving minutes off routes. A plumbing or HVAC fleet cares more about vehicle uptime and driver safety scores, since a single missed appointment can cost a customer relationship. Both are fleet optimization. They just weigh the components differently.
How Does Fleet Optimization Work?
Fleet optimization isn't a one-time project you finish and file away. It runs as a continuous operational loop: collect data, analyze it, act on it, monitor the results, then repeat.
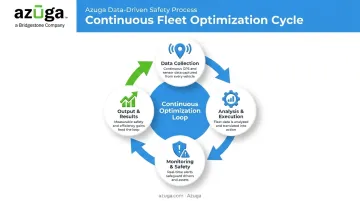
Initiation: Data Collection
Everything starts with data: vehicle location, fuel usage, driver behavior, and maintenance history. This used to mean paper logs and end-of-day phone calls. Now it's largely automated.
Azuga's platform, for example, collects this data through a modular hardware setup
- OBD-II devices (like the Azuga G2) that plug into a vehicle's diagnostic port and capture engine data, fuel use, idle time, and driving behavior
- Smartphone apps (Azuga FleetMobile) for trip tagging, diagnostics, and driver messaging
- Dashcams that capture road and in-cab footage automatically
- Long-life asset trackers for trailers, generators, and equipment that don't have engines
Fleets still relying on manual entry hit a wall here. Delayed or incomplete data undermines every stage that follows. You can't optimize a route or catch a maintenance issue you don't know about yet.
Core Operation: Analysis and Execution
Once data flows in, software algorithms scan it for inefficiencies: wasted routes, excessive idle time, poor fuel economy, risky driving habits. This is where raw numbers turn into action.
During execution, three things typically happen at once
- Route optimization adjusts based on live traffic and job locations
- Predictive maintenance scheduling flags problems before they become breakdowns
- Driver coaching recommendations emerge from behavior pattern analysis
The speed and accuracy of this stage depends heavily on how often data refreshes. The U.S. Department of Energy notes that telematics-based monitoring of speeding, idling, and harsh braking can lower fleet fuel use by 10% to 25%, but only if the underlying data is current enough to act on.
This is why update frequency matters. Azuga's high-frequency tracking refreshes vehicle location every 30 seconds, compared to the 1-to-5-minute intervals common on many conventional platforms. That difference shows up in dispatch decisions, ETA accuracy, and how quickly a manager can reroute a vehicle around a problem.
Regulation and Control: Monitoring and Safety
Optimization doesn't stop once a route is set or a maintenance ticket is scheduled. The system needs to catch problems in real time, before they become expensive.
This stage relies on
- Real-time alerts for speeding, harsh braking, idling, and geofence violations
- Automated driver coaching triggered by specific behavior patterns
- Video-based incident review that flags risky events within seconds
AI dashcams add a layer that pure GPS tracking can't. Azuga's SafetyCam AI, for instance, uses dual-facing cameras and collision reconstruction to document exactly what happened during an incident.
Azuga's own data shows that 70% of accidents involving fleet vehicles are not the fault of the fleet driver, a finding that matters enormously when a claim or lawsuit is on the line.
One documented case: dashcam footage helped police determine a fleet vehicle wasn't at fault in a collision, avoiding over $50,000 in forensic reconstruction costs and a potential $1 million claim.
The National Transportation Safety Board has similarly found that onboard video provides evidence about driver actions and crash circumstances that other data sources simply can't supply.
Output and Result
When the cycle runs correctly, the output is tangible: shorter routes, less idle time, safer driving patterns, and lower maintenance bills. These aren't abstract wins: they feed directly into budgeting, compliance reporting, and decisions about when to replace aging vehicles.
Azuga customers report an average of:
- 38% fewer accidents
- 57% fewer speeding citations
- $9,462 in annual cost savings per customer
Diamond Engineering, a construction fleet, used telematics data and driver scorecards to negotiate more than a 10% discount on its insurance premium. That's the loop working as intended — data collection feeding analysis, analysis feeding action, and action feeding measurable financial results.
Where Is Fleet Optimization Used?
Fleet optimization applies wherever vehicles and drivers are operational cost centers. The main touchpoints include
- Dispatch and routing: assigning the closest available vehicle to a job
- Preventive maintenance scheduling: catching issues before breakdowns
- Driver management: scoring behavior and delivering coaching
- Compliance documentation: HOS logs, DVIRs, and inspection records
It delivers the most value under specific conditions: high-mileage fleets, multi-stop service routes, mixed vehicle types, and time-sensitive jobs where a delay costs real money.
Industry priorities vary:
| Fleet Type | Primary Focus |
|---|---|
| Trucking & logistics | Route efficiency, fuel cost, congestion avoidance |
| Construction | Equipment uptime, asset tracking, geofencing |
| Utilities & service fleets | Driver safety scoring, compliance, dispatch speed |
| Plumbing, HVAC, pest control | Technician dispatch accuracy, vehicle uptime |
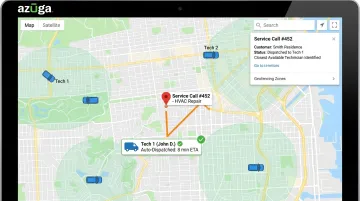
Plumbing and HVAC contractors using Azuga's geofencing and dispatch tools can send the closest available technician within seconds, cutting response time without adding staff.
Conclusion
Fleet optimization works as an ongoing cycle: collect data, analyze it, act on it, monitor what happens, then adjust. Skip a stage, and the whole loop weakens.
Fleets that run this cycle on an integrated platform like Azuga gain a real edge. They control costs, reduce accident risk, and base replacement and budgeting decisions on real numbers instead of guesswork.
Frequently Asked Questions
What is fleet optimization?
Fleet optimization is the data-driven practice of maximizing vehicle utilization, route efficiency, and driver safety while minimizing costs across a fleet's entire lifecycle. It combines GPS tracking, maintenance scheduling, and driver coaching into one continuous process.
What is the best fleet maintenance software?
The right choice depends on fleet size and needs. Look for platforms that pair GPS tracking and preventive maintenance alerts with built-in driver safety features. Azuga, for example, bundles all three plus ELD compliance and reporting with packages matched to fleet needs.
How much money can fleet optimization actually save a business?
Savings vary by fleet, but the U.S. Department of Energy notes telematics-based monitoring can cut fuel use by 10-25%. Azuga customers report average annual savings of $9,462 alongside a 38% drop in accidents.
What technology is used for fleet optimization?
The core stack includes OBD-II GPS trackers and AI-powered dashcams, paired with software that analyzes the incoming data. Long-life asset trackers are also used for trailers and equipment that lack engines.
Is fleet optimization only useful for large fleets?
No. Small fleets with just a handful of vehicles benefit similarly, and often see faster ROI since overhead costs are lower relative to savings. Platforms like Azuga support fleets ranging from a few vehicles to over a hundred.
How long does it take to see results after implementing fleet optimization?
Basic gains like tighter routing and reduced idle time often show up within weeks. Safety and total-cost trends take a few months to stabilize as data accumulates and coaching takes effect.