
Introduction
Insurers no longer size up your risk by age, zip code, and credit alone. They're increasingly watching how you actually drive, and boiling that behavior into a single number: the telematics score.
For personal drivers, this score decides whether that usage-based insurance discount sticks around at renewal. For fleet managers, it's become a core part of commercial auto insurance pricing, safety compliance, and liability defense. Fleets that actively manage those scores can see accident rates drop by an average of 38%, according to Azuga's fleet safety data.
Yet most drivers and business owners still don't know exactly what data feeds this score or how much it moves the needle on premiums.
This guide breaks down what a telematics score actually is, the specific factors that shape it, what counts as "good," and how to improve one. We'll also cover why commercial fleets have even more riding on their scores than individual drivers do.
Key Takeaways
- Telematics scores are data-driven risk ratings based on speed, braking, and mileage.
- Scoring scales vary by insurer (0-100, letter grades, or proprietary), so "good" is relative.
- Travelers advertises up to 30% savings at renewal via IntelliDrive; actual savings vary by carrier.
- Smooth braking, obeying speed limits, and limiting phone use raise your score fastest.
- For commercial fleets, telematics scoring also supports liability management and accident dispute resolution.
What Is a Telematics Score in Insurance?
A telematics score is the calculated output of raw driving data, not the data itself. Insurers collect information like speed, braking force, mileage, and trip timing, then run it through a proprietary formula to produce a single risk rating. That rating determines how much of a usage-based insurance (UBI) discount a driver or fleet ultimately qualifies.
Telematics refers to the technology that gathers driving data. The score is the processed metric insurers use to price risk. These terms get used interchangeably, but they're not the same thing, and knowing the difference matters when you're trying to figure out what's actually affecting your premium.
How the Data Gets Collected
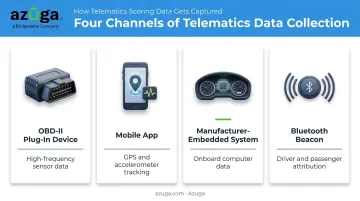
Insurers and fleet platforms pull data through a few main channels, each with different levels of detail
- OBD-II plug-in devices — connect directly to a vehicle's diagnostic port and capture high-frequency sensor data like hard braking, rapid acceleration, and cornering
- Mobile apps — use a phone's GPS and accelerometer to track trips, though accuracy can vary depending on phone placement
- Manufacturer-embedded systems — built into newer vehicles, pulling data straight from onboard computers
- Bluetooth beacons — help distinguish driver from passenger in shared vehicles, improving attribution accuracy
Azuga's OBD-II devices, for example, capture events like hard braking and aggressive cornering while also delivering real-time in-car alerts the moment they happen. That immediacy lets drivers self-correct on the spot rather than finding out about a bad habit weeks later during a review.
From Enrollment to Renewal
Most UBI programs follow a similar structure
- Enroll and get an upfront discount just for participating.
- Drive normally for a monitoring period, commonly 90 days. Travelers, for instance, tracks household driving behavior for exactly this window before recalculating rates.
- Receive an adjusted premium based on your actual telematics score.
Insurers shifted toward this model because static factors like age and credit only tell part of the story. Behavior-based data lets carriers price risk more precisely.
That shift has picked up real momentum. According to TransUnion's 2022 telematics survey, the share of consumers offered telematics programs rose from 32% to 40% in a single year, while acceptance jumped from 49% to 65%.
How Telematics Scores Are Calculated: Key Factors
Every provider weighs things slightly differently, but most scoring models pull from the same core set of driving behaviors
- Speed: How often and how severely a driver exceeds posted limits is one of the most heavily weighted inputs across nearly every scoring system. A single 10-mph event won't sink a score, but repeated speeding does.
- Braking and acceleration: G-force sensors flag sudden stops and aggressive takeoffs, strong proxies for aggressive or distracted driving.
- Cornering: Accelerometer data picks up sharp or fast turns, which reads as risky maneuvering even if no incident occurs.
- Mileage and time of day: More miles driven means more exposure to risk, and late-night trips compound that risk further since conditions and other drivers' behavior are less predictable after dark.
- Phone distraction: Modern systems detect phone handling or screen interaction while a vehicle is moving, a factor that has grown as distracted driving becomes a bigger contributor to crashes.
Turning Multiple Signals Into One Score
None of these factors work in isolation. Providers assign different weights to each behavior based on their own actuarial data, then normalize results per mile driven so a high-mileage commuter isn't unfairly penalized compared to someone who drives less.
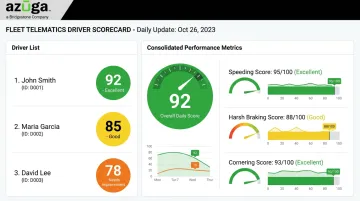
This mirrors how enterprise risk-scoring works at the fleet level. Composite risk indexes combine speeding, braking, cornering, and distraction data into one holistic score per driver, giving fleet managers a single number to track instead of sifting through raw event logs. Azuga's platform consolidates these behaviors into a driver scorecard that tallies performance across categories and rolls them into one overall rating, updated daily as new trip data comes in.
What Is a Good Telematics Score?
Here's the honest answer: there's no universal "good" number. Scoring scales differ dramatically between providers.
- Some use a 0-100 numeric scale
- Others use letter grades (A through F)
- A few use proprietary breakdowns, like Azuga's system, which scores speeding, acceleration, and braking separately
A score that looks strong on one platform might be middling on another because the underlying formula and weighting are completely different. What matters is your standing relative to that specific program's top-performing drivers, not the raw number itself.
That relative standing carries real weight at renewal, since most UBI programs use a tiered discount structure. You get an initial discount just for enrolling, then a final adjusted rate once your actual score is calculated at renewal. Travelers advertises savings of up to 30% at renewal through its IntelliDrive program, though this represents a maximum, not a typical average across policyholders.
Don't fixate on hitting a specific number. Focus on the underlying behaviors, since that's what actually drives the score wherever you land.
How to Improve Your Telematics Score
Improving your score comes down to changing a handful of specific habits rather than overhauling how you drive.
- Brake and accelerate smoothly. Anticipate stops earlier and ease off the gas instead of flooring it. Harsh-event flags are among the most heavily weighted factors in most scoring models.
- Stay within posted speed limits, especially in school zones and areas with variable limits. Speeding events are consistently among the most penalized behaviors across every major program.
- Limit phone handling while driving. Enable driving mode or do-not-disturb settings so distraction events don't get logged in the first place.
- Cut back on late-night driving where possible. The Federal Highway Administration reports the nighttime fatality rate is three times higher than the daytime rate, so insurers weight those hours accordingly.
- Review your trip-by-trip feedback regularly. Don't wait for renewal to find out something's dragging your score down.
Azuga drivers can do this directly through the Azuga FleetMobile app, which breaks down category scores for speeding, acceleration, and braking individually. The Azuga Coach feature then assigns short training modules based on whichever category needs the most work, so drivers get specific, actionable feedback instead of just a number.
Telematics Scoring for Commercial Fleets and Businesses
Fleet-based businesses face a more complicated version of this problem. Construction crews, HVAC contractors, trucking companies, and landscaping outfits aren't managing one telematics score. They're managing dozens or hundreds, and the stakes go well beyond a single insurance discount.
Fleet telematics scoring serves three distinct purposes at once
- Insurance pricing — aggregate driver risk influences commercial auto premiums
- Safety liability management — identifying risky drivers before they cause an incident
- Claims dispute resolution — providing evidence when accidents happen and fault is contested
Beyond the Score: Proving Fault
This last point matters more than most fleet operators realize. A telematics score tells you a driver's risk level, but it doesn't settle a dispute after a crash. That's where video evidence changes the equation.
Azuga's SafetyCam AI, paired with Collision Reconstruction technology, addresses this gap directly. The AI neural learning network analyzes driver-facing footage to flag distraction events, while the road-facing camera captures what actually happened in a collision.
Azuga reports that this combination helps prove roughly 70% of accidents are not the fault of the fleet's drivers, which can be the difference between a costly settlement and a quick exoneration.
The Business Case for Fleet Telematics
Better scores translate into measurable operational outcomes, not just lower premiums. Azuga customers report:
- An average 38% decrease in accidents
- A 57% reduction in speeding citations
- Annual savings of $9,462 from more effective fleet cost management
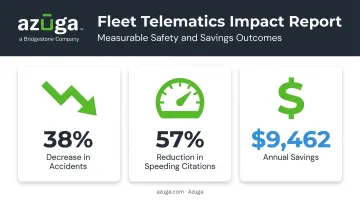
These numbers reflect what happens when fleets treat telematics scoring as a safety tool first and an insurance lever second. Fewer harsh-braking events and speeding citations mean fewer claims, which means fewer conversations with your insurer about rate increases.
Fleets that integrate scoring with real-time coaching, rather than just reviewing reports after the fact, tend to see the sharpest improvements.
Frequently Asked Questions
What is a telematics score?
It's a data-driven risk rating calculated from driving behaviors like speed, braking, cornering, and mileage. Insurers use it to price usage-based auto coverage for both individuals and commercial fleets.
What is a good telematics score?
"Good" varies by provider since scoring scales differ (0-100, letter grades, or category breakdowns). Generally, it means landing in the top range that qualifies for a provider's maximum available discount.
How can I improve my telematics score?
Focus on smoother braking and acceleration, obeying speed limits, avoiding phone handling while driving, and reducing late-night trips. Reviewing trip-by-trip feedback regularly helps you catch problem patterns early.
Is a telematics score the same as usage-based insurance?
No. Telematics is the data-collection technology; the score is one output insurers use within a broader usage-based insurance pricing model that also considers other rating factors.
Does telematics affect commercial auto insurance rates for fleets?
Yes. Fleet telematics scores help insurers assess aggregate driver risk across a business's entire vehicle roster, which directly influences commercial premium pricing and renewal terms.
Can I opt out of telematics tracking once I've enrolled?
Most programs allow you to opt out, but doing so typically means losing your enrollment discount or reverting to standard, non-telematics rating factors at your next renewal.