
Introduction
In 2024, transportation incidents caused 1,937 of the 5,070 fatal workplace injuries recorded in the United States, making driving the single largest cause of occupational death that year, according to the Bureau of Labor Statistics.
That's not an abstract number for fleet managers. It's a daily operational risk sitting behind the wheel of every vehicle they can't personally ride along in.
Here's the core problem: you can't watch every driver, every mile, every day. A driver who rolls through a stop sign on Tuesday and tailgates on Thursday looks fine on paper, right up until the moment a pattern becomes a collision.
This article breaks down what driver risk profiling and assessment actually mean, how the data and scoring work, and how fleets use both to prevent crashes and cut costs before an incident forces the conversation.
Key Takeaways
- Risk profiling flags behavior patterns, not one-off incidents, to predict future collisions
- Strong profiles blend telematics data, dashcam footage, and driver history into a score
- Profiling supports targeted coaching, better insurer talks, and stronger legal defense
- GPS tracking and AI dashcams turn profiling from guesswork into continuous, objective data
What Is Driver Risk Profiling and Assessment?
Driver risk profiling is the practice of identifying patterns in driving behavior that signal a higher likelihood of a future incident. It differs from reacting to a single bad event. One hard brake doesn't make someone a dangerous driver. A driver who hard-brakes weekly, speeds regularly, and tailgates on highways does.
Driver risk assessment is the wider process wrapped around that profile. It's how fleets gather, score, and interpret driver data, including licensing history, violations, telematics events, and behavioral trends, to quantify how much risk a driver actually represents.
Common behavioral indicators feeding into a profile include
- Harsh braking and rapid acceleration
- Speeding, especially repeated or severe violations
- Tailgating and following too closely
- Rolling stops at signs or lights
- Phone use and other distraction events
- Seatbelt noncompliance
None of these, alone, tells the full story. Together, over time, they build a picture that's far more predictive than any single dashcam clip.
Risk Categories: Low, Medium, and High-Risk Drivers
Profiling segments drivers into tiers, typically low, medium, and high-risk, based on how consistent unsafe habits are, not just how many events show up on a report.
A driver with one speeding flag in three months looks very different from one with weekly violations. This segmentation lets fleet managers
- Prioritize coaching time and budget where it matters most
- Show insurers and leadership a documented, proactive safety process
- Avoid wasting training resources on drivers who need reinforcement, not correction
The perception gap is real, and it matters here: AAA's 2023 Traffic Safety Culture Index found that 96% of drivers called drowsy driving dangerous, yet 20% admitted doing it in the past month. The same gap showed up with texting: 93% called it dangerous, 37% did it anyway.
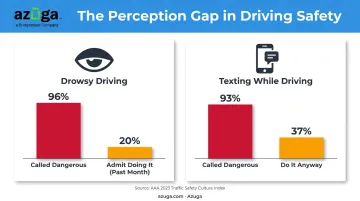
Self-perception and actual behavior often don't match. That's exactly why objective data, not driver self-reporting, has to drive the risk tier.
How Driver Risk Assessment Works: Data, Scoring, and Technology
A useful risk profile pulls from more than one source. The strongest assessments combine
- Telematics events — speeding, harsh braking, rapid acceleration, cornering, idling
- Dashcam AI video — visual confirmation of what triggered an event, including distraction
- Licensing and violation history — convictions, prior crashes, regulatory flags
- Vehicle diagnostics — maintenance and health data that can contextualize behavior
Platforms like Azuga pull telematics events, SafetyCam video, and (through integrations such as SambaSafety) licensing and claims data into one profile, rather than leaving fleet managers to piece it together across separate reports.
Scores Should Move, Not Sit Still
Modern platforms convert this raw data into a driver score rather than a permanent label. A driver's score should shift week to week as new behavior comes in. Azuga's Driver Score, for example, updates daily based on speeding, harsh braking, acceleration, and idling data, which keeps the picture based on this week's driving, not a stale snapshot from months back.
Not every event carries equal weight, either. Research backs this up. In an ATRI study of 583,805 U.S. commercial truck drivers, prior driving records were linked to sharply different increases in future crash likelihood:
| Prior Record | Increase in Future Crash Likelihood |
|---|---|
| Speeding violation | 47% |
| Reckless-driving violation | 104% |
| Failure-to-yield violation | 141% |
| Prior crash | 113% |
Source: ATRI, Predicting Truck Crash Involvement (2022)
That's the logic behind severity-weighted scoring: a failure-to-yield event should move a risk score more than a single minor speeding blip.
Trend analysis matters just as much as any single number. Rolling windows, whether weekly or over 90 days, help distinguish a bad Tuesday from a developing pattern. Continuous, high-frequency tracking checks this pattern in near real time. Azuga's CompleteFleet plan pushes GPS updates as fast as every 30 seconds and pairs that with AI dashcam analysis through Azuga SafetyCam, giving fleets ongoing visibility instead of periodic guesswork.
Benefits of Driver Risk Profiling for Fleets
Risk profiling isn't just a compliance exercise. It changes how coaching, insurance conversations, and legal exposure actually play out.
- Targeted coaching: Managers address each driver's specific weak point — tailgating, phone distraction, hard braking — instead of running everyone through the same defensive-driving course. This cuts repeat violations far more effectively than one-size-fits-all training.
- Stronger insurer conversations: Carriers increasingly require proof of active risk management before extending discounts. Programs like The Hartford's FleetAhead and Progressive's Snapshot ProView tie savings directly to verified telematics participation.
- Better legal defensibility: Showing that you identified a driver's risk pattern and acted on it, through coaching, alerts, or retraining, demonstrates reasonable care that holds up in litigation.
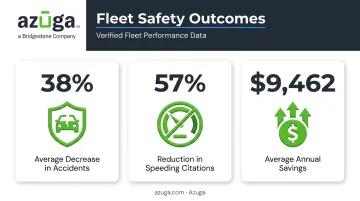
Azuga's own fleet performance data illustrates the scale of impact
- 38% average decrease in accidents
- 57% reduction in speeding citations
- $9,462 in average annual savings through better fleet cost management
Beyond the cost savings, risk profiling answers a critical fault question, too. Azuga's SafetyCam AI with Collision Reconstruction is built specifically to prove fault after a crash, and Azuga notes that 70% of accidents are not the fault of fleet drivers. That evidence can exonerate a driver and cut off costly litigation before it drags on for months.
Best Practices for Implementing Driver Risk Profiling
Rolling out risk profiling badly, treating it as pure surveillance, backfires fast. A few principles keep it effective
- Be transparent from day one. Tell drivers exactly what's collected, why, and how it's used before launch, since trust erodes quickly when monitoring feels sprung on people.
- Build in two-way validation. When an event gets flagged, give drivers a way to add context, because a hard brake to avoid a pedestrian isn't the same as a hard brake from tailgating. AI dashcams with collision reconstruction, like Azuga's SafetyCam, capture that context automatically instead of relying on a driver's word alone.
- Recognize low-risk drivers, not just flag high-risk ones. Gamified scorecards, safe-driving competitions, and rewards reinforce the behavior you want instead of only penalizing the behavior you don't.
Programs that skip step three tend to feel punitive. Programs that include it tend to see safety scores climb steadily, since drivers buy into a system that rewards good habits instead of just flagging mistakes.
Choosing the Right Driver Risk Profiling Technology
Not every fleet needs enterprise-grade complexity. For small and mid-sized fleets in construction, HVAC, trucking, and service fleets, the right technology needs to work fast and stay affordable.
Look for these core features:
- Easy-to-install hardware that doesn't require a mechanic or downtime
- GPS update intervals as frequent as every 30 seconds for real-time visibility
- AI-based dashcam analysis that flags distraction, not just speed
- Clear, coachable driver scorecards that managers and drivers can both read
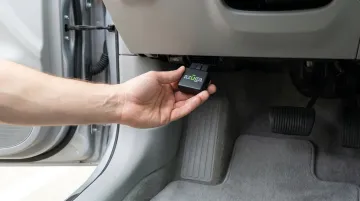
Ease of deployment matters more than most buyers expect. Azuga's OBD-II tracker plugs directly into a vehicle's diagnostic port and transmits data in about 20 seconds, with no scheduled install and no vehicle downtime.
That plug-and-play approach, combined with real-time visibility and 24/7 support, makes risk profiling accessible for fleets that don't have a dedicated safety department running the program.
Frequently Asked Questions
What is driver profiling?
Driver profiling is the process of analyzing driving behavior data over time to identify patterns linked to accident risk. It's distinct from a one-time evaluation because it tracks trends, not isolated events.
What factors are used in driver risk assessment?
Key factors include harsh braking, speeding, tailgating, distraction events, licensing history, and violation records. Assessment combines these into a single risk picture rather than judging any factor alone.
Is driver risk profiling the same as a telematics score?
No. A telematics score is one input into a profile. Risk profiling combines that score with dashcam video, violation history, and behavioral trends for a fuller picture.
How often should driver risk profiles be updated?
Most platforms use rolling periods, such as daily updates or 90-day trends, to keep profiles current. Azuga's Driver Score, for example, recalculates daily based on new driving behavior.
What is considered a good driver safety score?
Many telematics platforms default to a benchmark around 80 out of 100, though fleets can and should adjust this based on their own risk tolerance and operating conditions.
How does driver risk profiling help reduce insurance costs?
Documented profiling paired with telematics or dashcam use can support insurer discounts and stronger claims negotiations. Programs like FleetAhead and Snapshot ProView explicitly reward verified telematics participation.