
Introduction
Every fleet generates a flood of data. GPS pings, engine diagnostics, fuel purchases, harsh-braking alerts—it never stops. But raw data doesn't fix anything on its own.
Many fleet managers fall into one of two traps: they track too few numbers and miss obvious cost leaks, or they drown in dashboards full of stats nobody acts on. Either way, the result is the same: wasted fuel, avoidable accidents, and maintenance bills that show up as surprises instead of line items you planned.
This guide breaks down what fleet management metrics actually are, the four core categories every fleet should monitor, and the specific KPIs worth your attention. It also covers how modern GPS tracking software takes the manual work out of collecting and acting on them.
Key Takeaways
- Metrics are raw data points; KPIs are the specific metrics tied to a business goal
- Metrics fall into four categories: safety, cost, utilization, and maintenance/compliance
- Tracking fuel efficiency, uptime, and safety scores cuts costs and reduces accidents by up to 38%
- Telematics platforms automate collection, replacing manual logs with real-time insight
What Are Fleet Management Metrics?
Fleet management metrics are the quantifiable data points collected from your vehicles, drivers, and assets. That includes
- Location and GPS data — where a vehicle is and where it's been
- Telemetry — speed, engine health, fuel consumption
- Maintenance records — service history, repair frequency, downtime
- Driver behavior — braking, acceleration, speeding events
- Safety incidents — accidents, near-misses, citations
Not every metric is a KPI, though people use the terms interchangeably. A metric is simply any measurable data point, like total miles driven this month. A KPI (Key Performance Indicator) is a metric deliberately tied to a business goal or benchmark, per APQC's framework.
Miles driven is a metric. Cost per mile compared against a $2.10 target is a KPI.
Why Fleet Management Metrics Matter
Metrics aren't just reporting exercises. They surface real money.
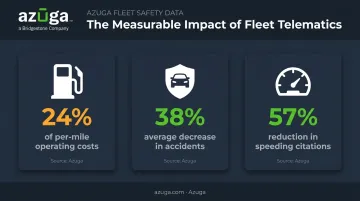
Fuel alone can eat up a large chunk of a fleet's budget. In fact, fuel represented 24% of motor carriers' per-mile operating costs from 2014 through 2023, according to FleetOwner's analysis of ATRI data, with some fleets seeing it climb even higher. Without metrics like fuel cost per mile or idle time, that waste hides in plain sight.
Safety metrics matter just as much. Fleets using Azuga's driver behavior monitoring have seen a 38% average decrease in accidents and a 57% reduction in speeding citations.
Those numbers come from tracking specific driver behaviors, including hard braking, speeding, and distraction, then coaching against them. When you know exactly which drivers are at risk, you can intervene before there's a claim.
Beyond safety and fuel, metrics also support faster decisions on maintenance timing, DOT compliance, and whether your fleet is the right size for your workload.
The 4 Types of Fleet Performance Metrics
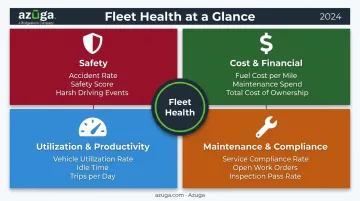
Most fleet metrics fall into four practical buckets. Together, they give you a full picture of fleet health, not just one slice of it.
Safety Metrics
These track how risky your fleet's driving actually is
- Accident rate
- Speeding events
- Harsh braking and acceleration
- Driver safety scores
Insurance carriers pay attention to these too. Fleets with documented safety improvements often see lower premiums and reduced liability exposure when claims do happen.
Cost/Financial Metrics
This is where fleet performance meets the balance sheet
- Fuel cost
- Cost per mile
- Maintenance spend
- Total Cost of Ownership (TCO)
For context, ATRI reports the average trucking operating cost hit a record $2.336 per mile in 2025, the highest figure in its series, according to ATRI's 2025 operational cost update. Excluding fuel, that figure drops to $1.854 per mile. Even if your fleet isn't long-haul trucking, the takeaway holds: cost per mile is the number that tells you whether operations are actually profitable.
Utilization/Productivity Metrics
Utilization metrics answer a simple question: are your vehicles earning their keep?
- Vehicle utilization rate: active hours divided by available hours
- Idle time: engine running, vehicle not moving
- Route efficiency: actual routes versus optimal ones
Low utilization often means you're paying for vehicles you don't need. High idle time usually points to wasted fuel and unnecessary engine wear.
Maintenance/Compliance Metrics
These metrics keep vehicles on the road and keep you out of regulatory trouble
- Preventive maintenance adherence
- Inspection pass/fail rate
- Vehicle uptime and downtime
Compliance isn't optional. CVSA's 2025 International Roadcheck, covering over 56,000 inspections, found an 18.1% vehicle out-of-service rate, with brake systems and tires accounting for the majority of violations, per CVSA's 2025 Roadcheck results. A solid preventive maintenance program catches these issues before an inspector does.
Top Fleet Management KPIs to Track
Within those four categories, a handful of specific KPIs give you concrete numbers to benchmark against
- Fuel Efficiency (MPG / fuel cost per mile): One of the largest controllable expenses in any fleet budget. Tracking cost per mile, not just total spend, helps you spot inefficient vehicles or routes before they drain your budget.
- Vehicle Utilization Rate: Calculated as active hours divided by available hours, this KPI shows whether your fleet is right-sized. A fleet running at 40% utilization is carrying vehicles it probably doesn't need.
- Maintenance Cost Per Mile and TCO: Tracking these together prevents budget surprises and informs replacement timing. When a vehicle's maintenance cost per mile climbs past its purchase-and-fuel cost, it's usually time to retire it.
- Driver Safety Score / Accident Rate: Behavior-based scoring turns subjective "risky driver" guesswork into data, giving you proof when things go wrong. Azuga's SafetyCam AI with Collision Reconstruction is designed to exonerate drivers in roughly 70% of accidents, handing fleet managers documentation instead of a dispute with an insurance adjuster.
- On-Time Delivery Rate and Compliance Rate: These connect fleet performance directly to customer experience and regulatory standing. Miss deliveries or fail inspections, and the cost shows up in lost contracts or fines, not just fleet spreadsheets.
How to Track and Analyze Fleet Metrics Effectively
Collecting data is the easy part. Turning it into results takes a process.
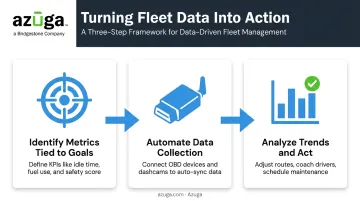
Identify metrics tied to specific goals. Don't try to track everything at once. If your goal is cutting fuel spend, start with fuel cost per mile and idle time, not a dozen unrelated dashboards.
Automate data collection. Manual logs introduce errors and gaps, while Azuga's OBD-II device plugs into a vehicle's diagnostic port and starts transmitting in as little as 20 seconds—no wiring or technician required. Paired with 30-second GPS interval tracking, fleet managers get near real-time visibility instead of end-of-day guesswork.
Analyze trends and act on them. A dashboard is only useful if someone looks at it and does something. That might mean
- Adjusting a route that's consistently running long
- Coaching a driver with rising speeding events
- Scheduling preventive maintenance before a diagnostic code becomes a breakdown
Once you've identified quick wins from these actions, tools like Azuga's ROI calculator can help estimate potential savings before you commit to a full rollout, based on your fleet's actual size and use case.
Common Mistakes to Avoid When Tracking Fleet Metrics
Even fleets with good intentions get this wrong. Watch for these three traps.
- Tracking too many metrics at once. Without tying each one to a specific business objective, you end up with analysis paralysis—lots of numbers, no clear next step.
- Relying on disconnected systems. Spreadsheets that don't talk to your maintenance software or dispatch tool create data gaps. Reports built on incomplete data lead to bad decisions.
- Collecting data without acting on it. This is the costliest mistake: a dashboard full of speeding alerts helps nobody if no one coaches the driver, and unused data becomes a liability once a preventable incident occurs.
Frequently Asked Questions
What are the KPIs for fleet management?
Common fleet KPIs include fuel efficiency, vehicle uptime, maintenance cost per mile, driver safety score, on-time delivery rate, and compliance rate. The right mix depends on your specific business goals.
What are the 4 types of performance metrics?
Fleet metrics are typically grouped into four categories: safety, cost/financial, utilization/productivity, and maintenance/compliance. Tracking all four gives a complete view of fleet performance.
What is the difference between a fleet metric and a fleet KPI?
A metric is any measurable data point, like total miles driven. A KPI is a metric deliberately tied to a specific business goal, such as cost per mile measured against a target benchmark.
How often should fleet managers review their metrics?
It depends on the metric. Safety alerts and vehicle availability often warrant daily or real-time review, while cost and utilization trends are typically assessed weekly or monthly.
What tools are used to track fleet management metrics?
GPS trackers, telematics devices, AI dashcams, and fleet management software platforms like Azuga automate the collection of location, behavior, and vehicle health data.
How does fleet management software improve the accuracy of tracked metrics?
Automated, real-time data capture removes the human error that comes with manual logs. Fleet managers get more consistent, up-to-date numbers to base decisions on, rather than end-of-week estimates.