
Introduction
Every mile a modern connected fleet drives creates data. Constantly. Azuga alone tracks 3 billion miles annually across 400,000-plus deployed devices, capturing 300 million trips worth of location, speed, and behavior signals.
That volume of information used to sit idle in a database. Now it's the foundation for predicting what happens next.
Automakers, dealers, and fleet operators have spent decades reacting: fixing vehicles after they break, launching recalls after defects surface, chasing leads that already went cold. Unplanned downtime, expensive recalls, wasted marketing spend, and preventable accidents all share the same root cause, a lack of foresight.
Predictive analytics changes that equation. This article breaks down predictive analytics for automotive businesses, covering
- What predictive analytics means for your business
- Where it delivers the most value across manufacturing, sales, and fleet operations
- Which tools and techniques power it
- The KPIs and challenges you'll need to manage along the way
Key Takeaways
- Predictive analytics converts IoT and telematics data into forecasts across manufacturing, sales, and fleet operations
- Applications span the full value chain, from production defects to dealership leads to driver safety
- Forecasting approach should match the goal: demand forecasting, defect prediction, and risk scoring differ
- Data quality and security remain the biggest barriers to getting predictive analytics right
What Is Predictive Analytics in the Automotive Industry?
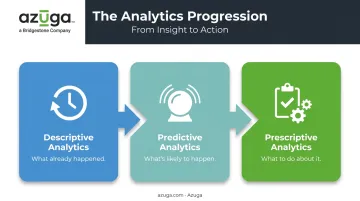
Predictive analytics uses historical and real-time data, statistical models, and machine learning to forecast what's likely to happen next. It sits in the middle of a three-part analytics spectrum
- Descriptive analytics tells you what already happened (last quarter's defect rate)
- Predictive analytics tells you what's likely to happen (which components will fail next)
- Prescriptive analytics tells you what to do about it (reroute production, schedule a repair)
Where the Data Comes From
Automotive companies pull predictive signals from several distinct sources
- Manufacturing sensor data – torque readings, weld quality, temperature and vibration logs from production lines
- CRM/DMS data – service history, purchase timelines, and customer interactions from dealership systems
- Telematics and GPS data – real-time vehicle location, speed, braking, and diagnostic codes captured by fleet telematics platforms like Azuga's
- Social media and market data – sentiment signals and third-party demographic data that inform demand and marketing decisions
Why This Matters Right Now
The automotive AI market, which includes predictive maintenance among other applications, is projected to grow from $18.83 billion in 2025 to $38.45 billion by 2030, a 15.3% compound annual growth rate. That's a broad category, not a pure measure of predictive operations spending. Still, the direction is unmistakable: automotive businesses that treat data as an asset are outpacing those that still treat it as a byproduct.
Top Use Cases of Predictive Analytics Across the Automotive Value Chain
Predictive Analytics in Manufacturing & Production
Quality control used to mean random spot checks. Audi's AI-based inspection system now analyzes roughly 1.5 million spot welds across 300 vehicles per shift, compared to the roughly 5,000 welds per vehicle checked manually under the old ultrasound method. The system flags anomalies for human review instead of relying on sampling alone.
Digital twin technology takes this further. Rather than building physical prototypes for every crash test or stress scenario, engineers simulate
- Brake-pad wear and degradation over thousands of virtual miles
- Braking-system remaining useful life under varying load conditions
- Component aging and fatigue before a single part is manufactured
This shifts quality control from catching defects after production to predicting where they'll occur before a vehicle ever leaves the plant.
Predictive Analytics in Supply Chain Optimization
Automotive supply chains run on thin margins and thinner timing windows. Predictive models help manufacturers
- Forecast parts demand across production lines and Tier 1 suppliers
- Right-size inventory to avoid both stockouts and excess warehousing costs
- Plan transportation routes that reduce fuel and logistics spend
Manufacturers that invest in supply-chain data analytics have reported inventory reductions of 20% or more, driven by better demand visibility rather than guesswork. The pattern holds across manufacturing sectors: better forecasting means fewer emergency shipments and less capital tied up in parts sitting on shelves.
Predictive Analytics in Dealership Sales & Marketing
Dealers don't need more leads; they need better ones. Predictive lead scoring analyzes vehicle age, mileage, warranty status, and lease-expiration timelines to flag customers likely to buy before they've even started shopping. That's the essence of conquest marketing: reaching in-market buyers ahead of competitors.
Some OEMs also mine social sentiment data to catch shifts in brand perception or model interest early, feeding that signal directly into inventory and marketing decisions. A spike in negative chatter about a specific trim, for instance, can trigger a pricing or promotional adjustment before sales actually dip.
Predictive Maintenance and Fleet Safety: Where Predictive Analytics Meets the Road
Manufacturing and dealership analytics matter, but fleet operators feel the impact of predictive analytics every single day, on every single route.
Predictive maintenance works by feeding IoT sensor and telematics data through models trained to spot abnormal patterns: declining battery voltage, uneven brake wear, engine performance drift. These signals surface before they turn into a breakdown on the highway.
Industry estimates suggest predictive maintenance programs can cut unscheduled downtime by up to 25%. Annual maintenance costs drop by roughly per vehicle compared with purely reactive repair models.
Driver behavior analytics extend this same logic to safety. AI-powered dashcams flag distraction, harsh braking, and speeding events in real time, turning individual incidents into a pattern fleet managers can coach against before an accident happens.
How Azuga Applies This on the Road
Azuga's GPS fleet management platform is a working example of predictive analytics applied to fleet operations
- Plug-and-play OBD-II device installs in minutes with no mechanic required, and starts transmitting data immediately
- 30-second high-frequency tracking gives fleet managers near real-time visibility instead of stale, hours-old location data
- SafetyCam AI with Collision Reconstruction analyzes driver-facing video to flag distraction and compile evidence after accidents, since roughly 70% of accidents aren't the fault of the fleet driver
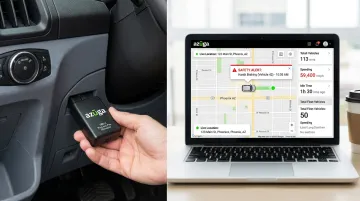
Acree Air, an Azuga customer, went from two accidents in a year to zero, and used that safety data to secure an $80,000 annual reduction in insurance premiums.
Across Azuga's customer base, the average outcomes include
| Metric | Result |
|---|---|
| Accident reduction | 38% decrease |
| Speeding citations | 57% reduction |
| Annual cost savings per fleet | $9,462 |
These results reflect predictive signals, tracking frequency, diagnostic alerts, and video analysis acted on before an incident occurs, not after.
Forecasting Techniques and Tools Powering Automotive Predictive Analytics
Common Forecasting Techniques Used in the Automotive Industry
Different problems call for different math. Here's how the main techniques map to automotive use cases
| Technique | Best suited for | Automotive application |
|---|---|---|
| Time-series analysis | Sequential, date-based data | Sales and production demand forecasting |
| Regression models | Continuous numeric targets | Estimating monthly unit demand from prior sales and market variables |
| Random forests | Classification problems | Flagging failure risk from component condition data |
| Neural networks | Complex, nonlinear patterns | Sales forecasting and real-time fault prediction from sensor streams |
| Monte Carlo simulation | Uncertainty and risk modeling | Reliability forecasting and supply chain risk scenarios |
Random forest models, for example, have been used to detect air-compressor failures in commercial trucks by classifying sensor readings against historical failure patterns. Monte Carlo simulation, meanwhile, is better suited to answering "what's the probability this part fails within 12 months?" than a single deterministic forecast.
Choosing the Right Predictive Analytics Tool
There's no universal best tool. The right choice depends entirely on what you're trying to predict. Common categories include
- General BI platforms (Power BI, Tableau) for dashboarding and cross-functional reporting
- ML platforms (Azure ML, IBM Watson) for custom model development
- Dealership-specific platforms for lead scoring and conquest marketing
- Fleet telematics and predictive maintenance platforms, like Azuga, purpose-built for vehicle health and driver risk data
When evaluating options, weigh these criteria
- Data integration capability – can it pull from your existing telematics, CRM, or ERP systems? Azuga's marketplace, for instance, connects with dozens of third-party platforms, including TowBook for towing dispatch.
- Scalability – does the platform grow with your fleet without a proportional jump in overhead? White-label and partner deployment options matter here for insurance carriers and larger operators.
- Industry-specific features – generic BI tools won't flag brake wear patterns or driver distraction events the way a purpose-built fleet platform will.
Measuring Success: KPIs and Overcoming Implementation Challenges
Key KPIs to Track in Automotive Predictive Analytics
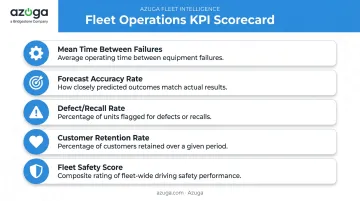
A KPI, in this context, is a measurable value that tells you whether your predictive model is actually improving outcomes, not just generating dashboards. Track
- Mean Time Between Failures (MTBF) – how long components or vehicles run before an issue occurs
- Forecast accuracy rate – how closely predicted demand or failure timing matches reality
- Defect/recall rate – frequency of quality issues reaching customers
- Customer retention rate – whether predictive service reminders and marketing keep customers coming back
- Fleet safety score or accidents per million miles – a direct measure of driver risk trends over time
Common Challenges in Implementing Predictive Analytics
Even good models fail without good inputs. The most common roadblocks include
- Data quality issues – incomplete, inconsistent, or siloed data undermines every model built on top of it
- Talent and expertise gaps – data science skills remain scarce relative to demand
- Security risks – moving sensitive vehicle, customer, or telematics data to cloud platforms introduces new exposure
The scale of this problem is well documented. Gartner predicts organizations will abandon 60% of AI projects unsupported by AI-ready data through 2026. A 2024 survey of over 1,200 data-management leaders found that 63% either lacked or weren't sure they had the data practices needed to support AI initiatives.
Fixing data readiness is the prerequisite for any predictive analytics program to work at all.
Frequently Asked Questions
What are the forecasting techniques in automotive industry?
The main techniques are time-series analysis, regression models, machine learning methods like random forests and neural networks, and Monte Carlo simulation. Each applies to different problems: demand forecasting, defect prediction, or reliability modeling.
Which tool is best for predictive analytics?
There's no single best tool. It depends on the use case. BI platforms suit reporting, ML platforms suit custom modeling, and specialized tools like Azuga handle fleet maintenance and safety predictions specifically.
What is an example of predictive analytics in manufacturing?
Audi's AI-based weld inspection system analyzes roughly 1.5 million spot welds per shift, flagging anomalies for review instead of relying on manual sampling.
What is a KPI in the automotive industry?
A KPI is a measurable metric used to track performance against a specific goal. Common automotive examples include Mean Time Between Failures, defect/recall rate, and fleet accidents per million miles.
How is predictive analytics used in fleet management?
Fleet platforms combine telematics data with driver behavior analytics to predict maintenance needs and accident risk before they occur. GPS fleet management platforms like Azuga use high-frequency tracking and AI dashcams to flag issues in real time.
Is predictive analytics expensive to implement for small fleet businesses?
Not anymore. Plug-and-play telematics solutions have made predictive fleet analytics accessible to businesses of any size. Azuga's platform matches packages to fleet needs, putting predictive maintenance and safety scoring within reach for small operators.